Competitive Usability Assessment
UX Research
Project Summary
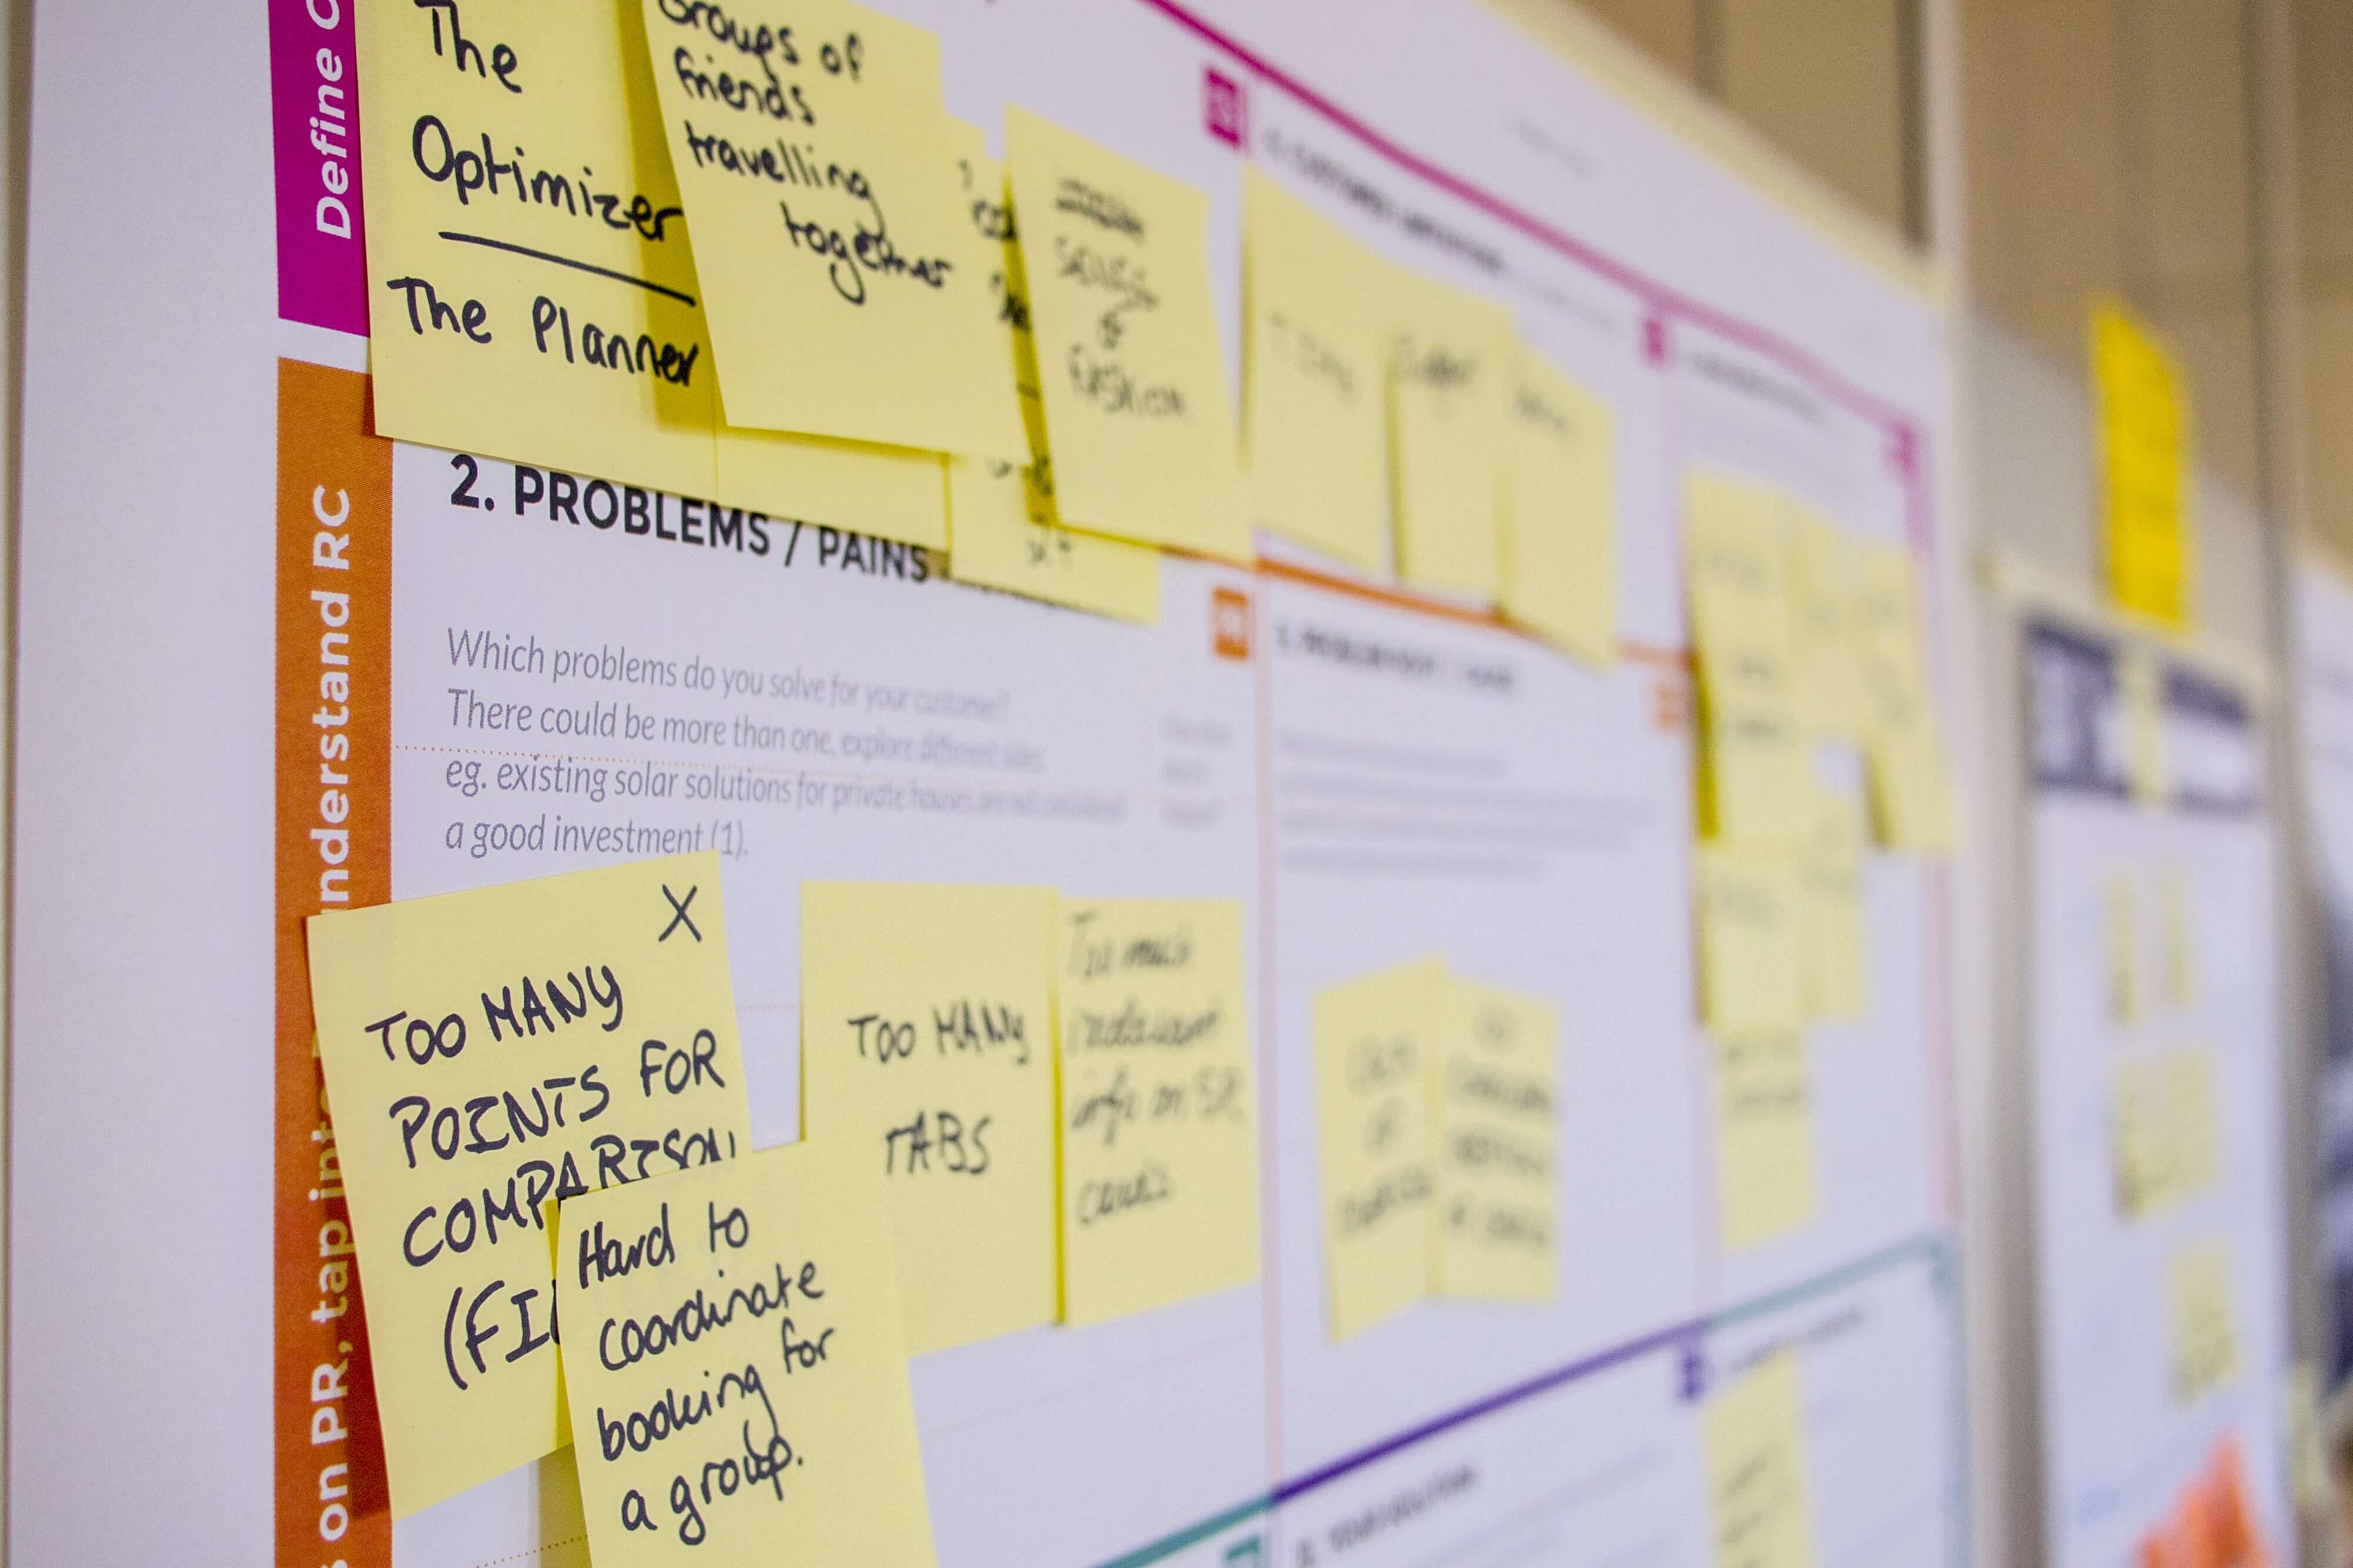
As a UX researcher at a company that offers products and services for homeowners, I conducted a competitive usability assessment on the residential insulation website. We wanted to learn what factors contribute to a great homeowner experience on finding insulation products and benchmark our experience against competitors.
Process
Conducting unmoderated usability testing on UserTesting.com was perfect for our needs. It would allow us to quickly get a lot of data as we were also testing competitors’ sites. Each site would be tested with the same set of tasks. I used the system usability scale (SUS) metric to quantify the experience and benchmark against competitors. Since we get a lot of mobile traffic as well, we tested both desktop and mobile experiences. For each site I ran a separate test for desktop and mobile experiences.
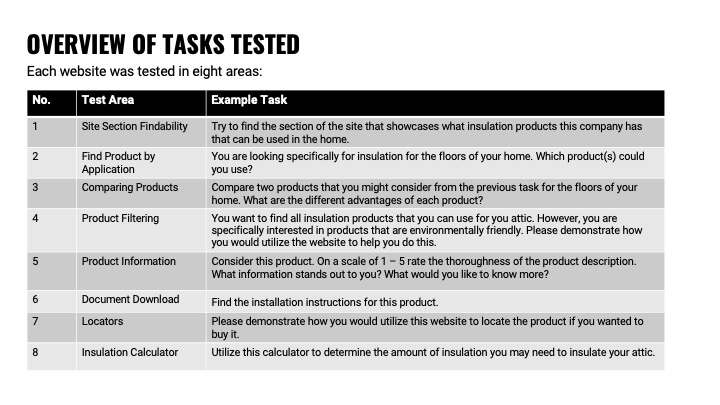
My approach to conducting this type of a competitive assessment begins with identifying the areas I want to conduct testing on, which I determined by breaking down the actions a homeowner would generally perform when looking for insulation. After completing all the tasks, participants answer the SUS questionnaire to rate their experience on the website.
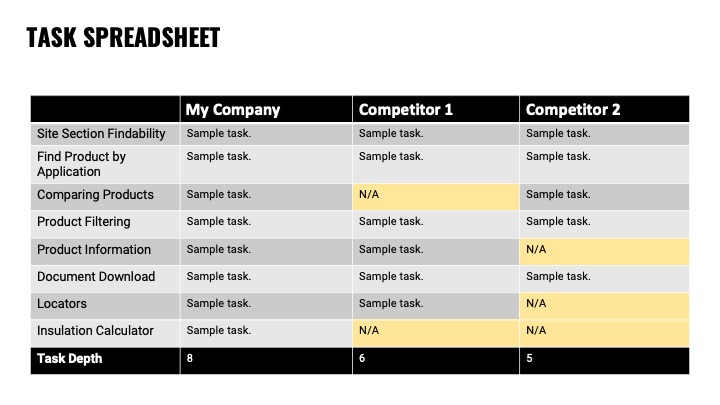
I like to keep things organized by creating a spreadsheet of tasks when conducting competitive assessments (image below). On the vertical side of the spreadsheet I include the different test sections, and on the horizontal side I include my company and our competitors. Each cell contains the task for that respective website. This is helpful when I have to tweak the wording on the tasks to fit competitors’ sites (e.g. referring to a specific product by name). It also assists me to quickly visualize which competitors lack a feature that we may have by highlighting the cell that doesn’t have the task. This refers to the task depth and is presented with the overall SUS score.
Before launching the tests, I always make sure to have the proper screener questions in place to narrow participants to those who resembled our user base the most. In this study I was targeting homeowners. Instead of asking participants directly whether or not they are homeowners, I gave them a list and asked them to select the option that best describes their living situation. The drawback of using a testing service like UserTesting.com is that many of the participants you reach could be professional test takers who take usability tests for a living. Writing the screener in this way reduces the ability of the participant to anticipate which answer would qualify him/her to take the test.
Findings
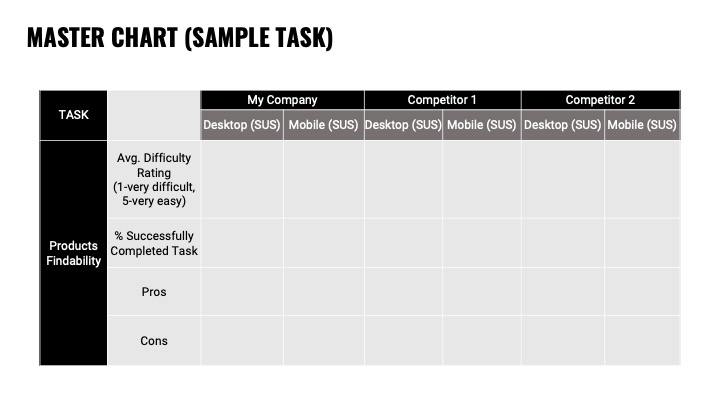
I gathered a mixture of quantitative and qualitative data for each site including the following: SUS score, percentage of participants who successfully completed each task, participants’ ranking of task difficulty/ease, and pros/cons associated with completing each task (with linked video clips). The master chart contained all the data, which I later extracted into different tables in order to present the information more clearly.
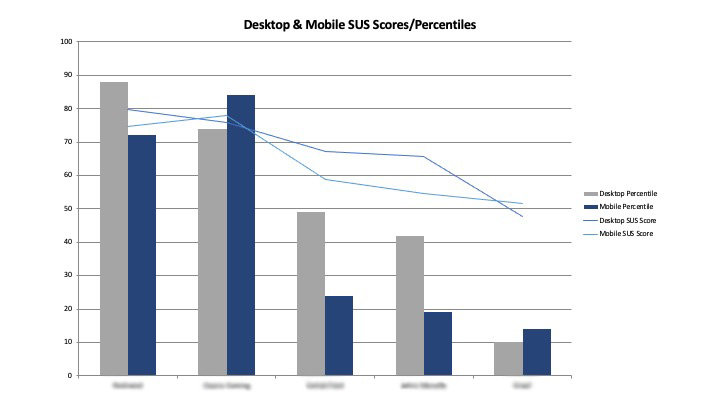
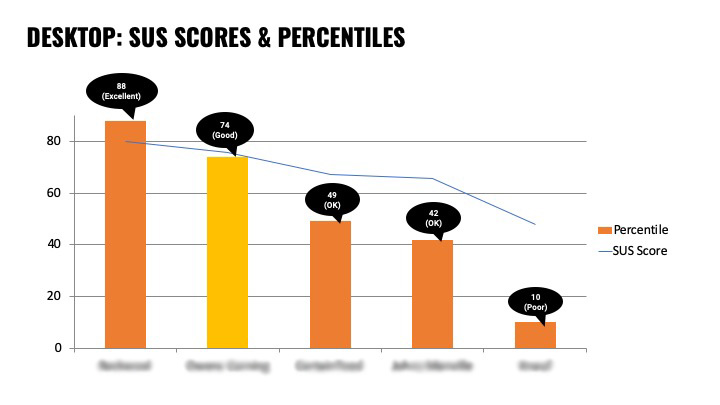
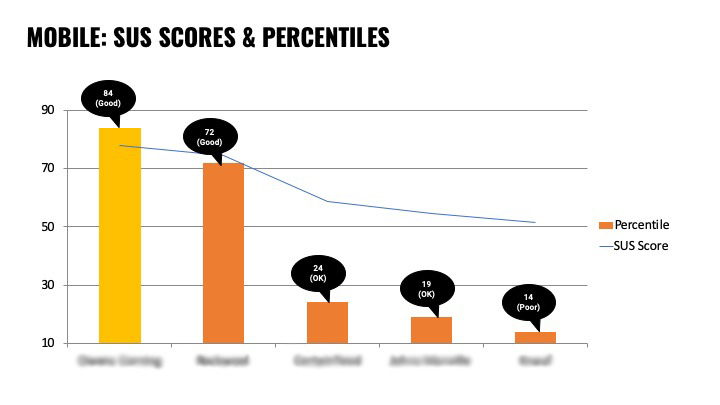
I usually document my findings in a report as well as a PowerPoint presentation. I began the PowerPoint with some slides on the study overview including the research objectives, process, and general SUS scoring information. I presented the desktop and mobile SUS scores as shown below. The SUS metric made comparing and benchmarking easy to present to stakeholders and helped them visualize where we stood in the industry.
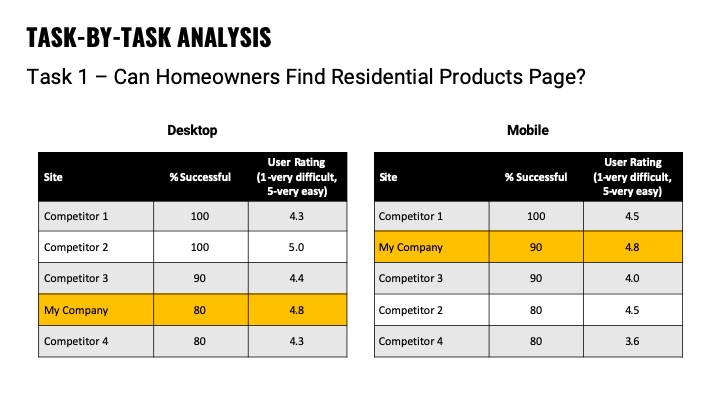
I then went into a task-by-task analysis. I started by showing the quantitative results pertaining to each task and the qualitative details to explain the numbers. I documented both the positives and the negatives of the experience which I displayed in the form of video clips and images. I also included a section on what we could learn from the competition and offered actionable recommendations.
Outcome
The results of this research informed next steps on improvements that could be made to the residential insulation website, specifically pertaining to the product search page. I assisted the design team in creating different prototypes that were tested with users. I also conducted more in-depth usability testing on the insulation calculator in order to pinpoint specific usability issues and offered recommendations.